Funnel analysis
Define a sequence of steps and measure how many visitors complete each one. Use funnel analysis to find where people drop off and improve your conversion rate.
- You can go beyond pageviews and use any custom events to build a funnel
- Choose between two funnel types: sequential (visitors can take other actions between steps) or strict order (steps must happen in exact consecutive order)
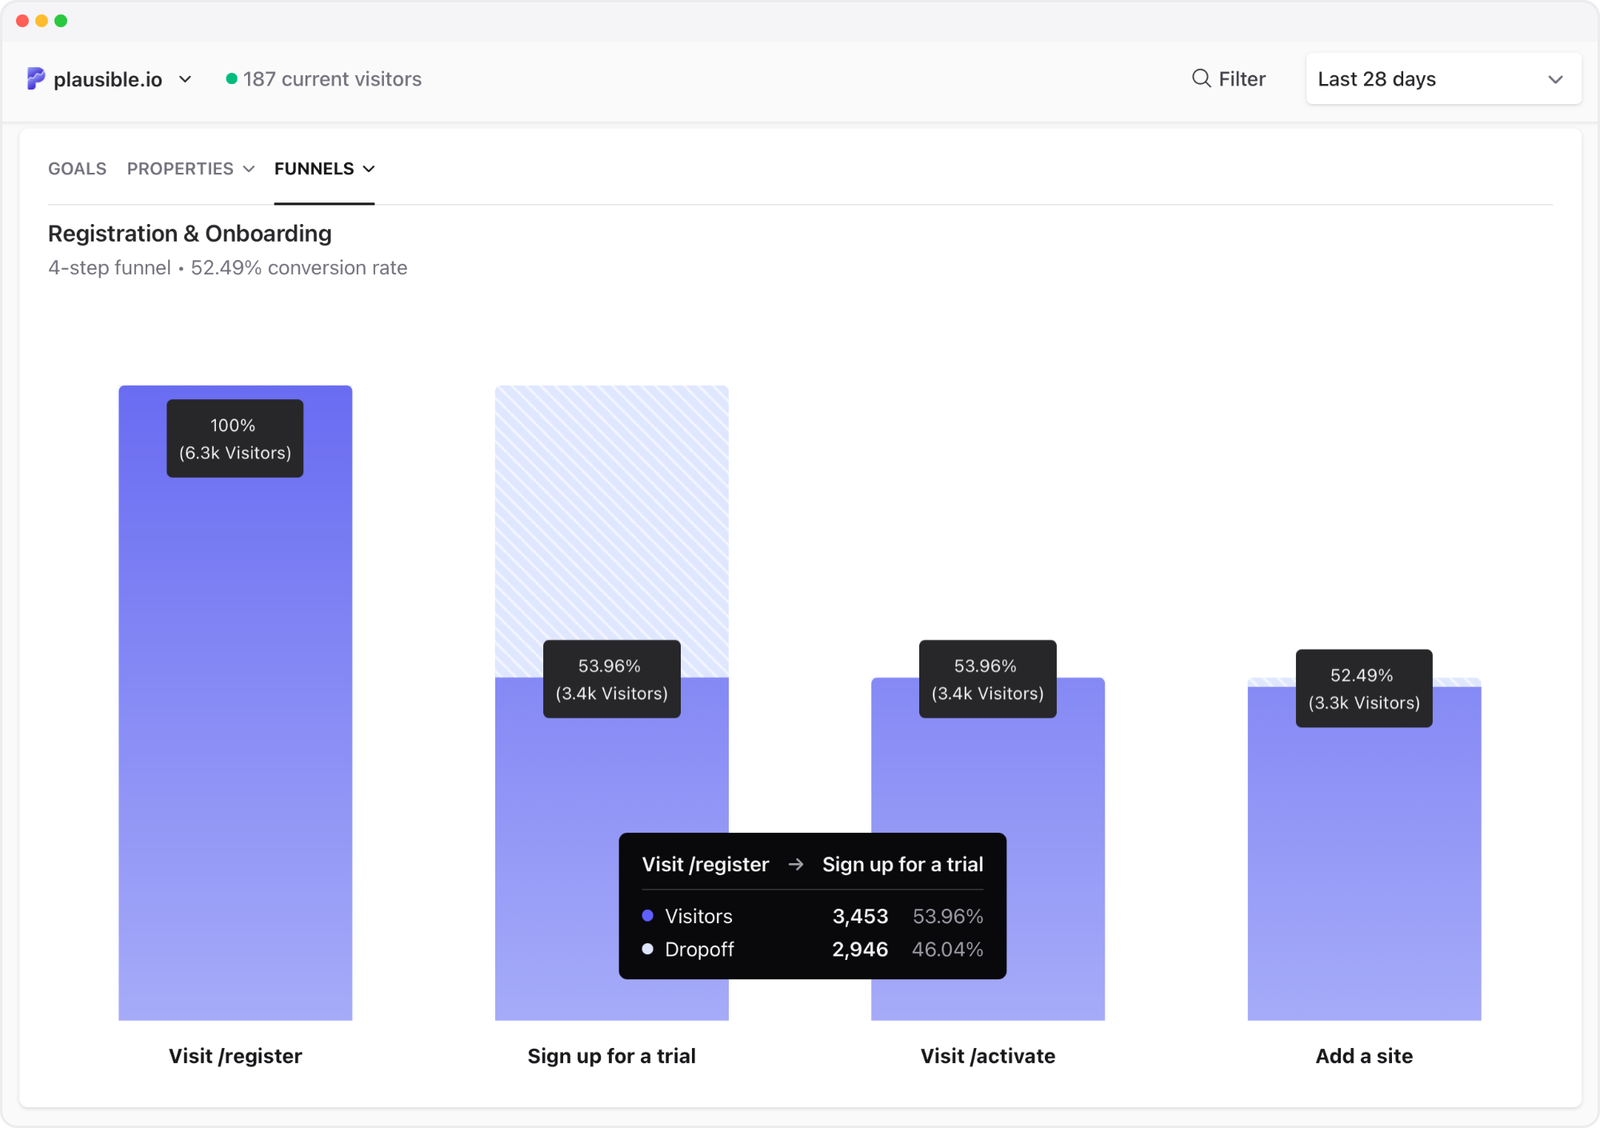
- With the conversion rate you understand the percentage of visitors who started the user flow and ended with a conversion event
- With the percentage drop-off between the individual funnel steps, you can spot where you lose the most visitors. A step with an unusually large drop-off is usually the best place to start optimizing
- You can get more granular by using filters to segment your audience. Filter conversion funnels by marketing campaign, referral source, landing page, device or location
How funnel conversions are counted
To be counted as converted, visitors need to complete all the steps you've defined in your funnel, in the correct order. Plausible offers two funnel types that differ in how strictly that order is enforced.
Sequential funnel (default): Visitors must complete the steps in order, but they can visit other pages or trigger other events in between. This is the more flexible option.
Strict order funnel: Every step must happen in exact consecutive order with no other actions in between. Use this when you want to measure a tightly defined path and any detour should disqualify the visitor.
Funnels in Plausible are always linear. Each funnel follows one defined path from start to finish. Branching or conditional paths are not supported. If you need to compare two different paths, create two separate funnels.
Funnels also work across your main domain and its subdomains (see more), and you don't need to worry about visitors briefly leaving your site to complete actions on external services like Stripe's payment page or other third-party gateways. Plausible treats the returning visit as part of the same session, so your funnel will accurately track the complete conversion sequence.
How to set up the conversion funnel analysis
-
Go into your site settings and click on Funnels in the left-hand sidebar
-
Click the Add funnel button to create a funnel.
-
Give your funnel a name in the Funnel name field.
-
Define your funnel by adding the steps you expect a visitor to take before a conversion, a purchase or a sign up. These steps consist of pageview goals and custom event goals. You need to add a minimum of 2 steps and a maximum of 8 steps to create a funnel. If you want a step to match only a specific variation of a custom event, use a property-filtered goal.
-
By default, the Allow other activity in between funnel steps option is enabled, which creates a sequential funnel. Disable it to use strict order mode instead.
-
Click on the Save button after you've defined the steps you want to measure
Funnels appear at the bottom of your dashboard as soon as the first visit is tracked on the funnel steps.
How to edit existing funnels
-
Go into your site settings and click on Funnels in the left-hand sidebar
-
Click on the edit icon on the right-hand side of the funnel that you'd like to edit.
-
Change the funnel name, edit the steps of your funnel and switch between sequential and strict order by toggling the Allow other activity in between funnel steps option
-
Click on the Update Funnel button
When to use funnel analysis
Use funnels when you want to measure how many visitors complete a specific multi-step sequence and where most of them drop off. Good candidates:
- A signup or onboarding flow (landing page → signup form → confirmation)
- An ecommerce checkout (product page → cart → checkout → order confirmation)
- A content conversion (blog post → email capture → thank you page)
- A trial-to-paid flow (trial signup → feature usage → upgrade page)
If you just want to count how many people reached a single page or clicked a button, a pageview goal or custom event goal is simpler. Funnels are most useful when the sequence of steps matters. If you do not have a specific path in mind and want to discover what visitors actually do, use user journeys instead.
Funnel examples
SaaS trial signup
A typical SaaS funnel might look like:
- Pricing page (
/pricing) - Registration page (
/register) - Onboarding step one (
/onboarding/step-1) - Dashboard (
/app/dashboard)
This shows you how many visitors who viewed pricing actually made it to the dashboard. A big drop between step 1 and 2 means the pricing page is not convincing. A big drop between 3 and 4 means onboarding is losing people.
Ecommerce checkout
- Product page (use a wildcard like
/products/*) - Cart (
/cart) - Checkout (
/checkout) - Order confirmation (
/checkout/order-confirmed)
Set this funnel to non-sequential if visitors might skip the cart and go directly to checkout.
Content to email signup
- Blog post (use
/blog/*to cover all posts) - Email signup page (
/newsletter) - Thank you page (
/newsletter/confirmed)
Interpreting funnel results
Drop-off rate by step
The drop-off between each step tells you where friction is highest. A funnel where 1,000 people enter step 1 but only 10 reach step 4 is expected: most funnels have large drops. Focus on the step with the largest proportional drop rather than the lowest absolute number.
What counts as a normal drop-off
There is no universal benchmark. A pricing → signup funnel might convert at 5-15%. A cart → purchase funnel might be 40-70%. Compare your current funnel against previous periods using the date range selector rather than industry averages.
Using filters to diagnose drop-off
Filter your funnel by traffic source, country or device to see whether drop-off is concentrated in a specific segment. For example: if mobile users drop off at step 2 at twice the rate of desktop users, the issue is likely a UX problem on mobile at that step.
Zero conversions on a step
If a step shows 0 conversions, check that the goal for that step is set up correctly and that the page URL in the funnel matches exactly what Plausible records. Use the Top Pages report to confirm the exact URL format being recorded.
Troubleshooting funnels
Funnel shows no data
The funnel only counts visitors after it was created. If the goals used as funnel steps have not been triggered since you saved the funnel, the funnel will show no data. Trigger each step on your site, then check the dashboard.
Also confirm that each goal used as a step is set up correctly in your site settings. A goal with a name mismatch or a page URL that does not match what Plausible records will produce zero entries at that step. Use the Top Pages or Goals reports to verify the exact values being recorded.
Numbers seem lower than expected
Check whether you chose strict order when sequential would be more appropriate. In strict order mode, any other page load or event between two steps disqualifies the visitor from that point in the funnel. If your visitors normally do other things between steps, strict order will produce much lower conversion numbers than sequential. Switch to sequential unless you specifically need to enforce an exact uninterrupted path.
You need more than 8 steps
Funnels are limited to 8 steps. If your flow is longer, split it into two funnels at a logical midpoint. For example, an acquisition-to-activation flow can be split into an acquisition funnel (landing page to signup) and an activation funnel (signup to first key action). Compare the two completion rates to find where the bigger drop-off is.
A step shows zero conversions
If one step shows zero while earlier steps have data, the goal for that step is likely misconfigured or has not fired yet since the funnel was created. See the custom event troubleshooting guide for how to verify events are firing correctly.
What's next?
- Track ecommerce revenue alongside your funnels to see which paths generate the most sales
- Use filters and segments to compare funnel performance across different traffic sources or campaigns
- Use property-filtered goals as funnel steps to track specific event variations, such as a sign-up for a particular plan
- Explore open-ended visitor paths with user journeys: useful when you want to discover flows rather than measure a predefined sequence
To learn more about conversion funnel optimization, head to our blog.